Winning public support for development
Stack is a polling and data analytics firm specialising in measuring public opinion. Through our work on political campaigns we have developed deep expertise in understanding how opinion varies in very small geographies (parts of wards within constituencies), and how to combine that insight with message testing to be as effective as possible in persuading a local audience.
In a political context the objective is to persuade a voter to choose your candidate. Planning is a (partly) political process, and we have been working with clients in the built environment to apply the same techniques in that domain.
Coverage over the past few days in The Times (£), The Guardian, CityAM, EG News and Property Reporter highlights part of our data - measuring overall support for development across England’s local authorities, and what people would prioritise were there to be investment in their local area - but Stack’s solution goes much further.
What problem are we solving?
Engaging on the ground with local communities will always be essential. What our data does is provide a reliable guide to representative opinion in a local area, so that the process is not (as it very often is currently) captured by a vocal minority with the time, inclination and (sometimes) resources to engage in the planning process. Methodological challenges (declining response rates for traditional polling modes in particular) are the best explanation as to why such research is not commonplace in planning, but with techniques honed in our political work we’re delighted to be able to restore some balance in assessing “what local communities want”.
How does it work?
We have built up a rich dataset of national opinion on development, running very large sample surveys of adults across Great Britain over the past two years. Our Site Reports are curated cuts of these data, organised into reports by Local Planning Authority for clients who regularly engage with the planning process. They use our data to assess developability pre-acquisition, to inform stakeholder engagement, and to design and communicate developments in a way that meets local preferences.
We ask people how they would prioritise investment in their local area, and also to rate their support for different types of development at various distances from their homes. We also collect attitudinal data so that we can segment the population in a hierarchical attitudinal segmentation tailored for the built environment. We then use MRP (Multi-level Regression and Poststratification) modelling to generate estimates of these data points at Output Area level. This is a very low level of geography - the lowest at which the ONS produces census data - and allows us to provide very detailed mapping of estimates around proposed sites for development.
In short, this data helps you to understand what people want in their local area, what sort of development they would support, and what clusters of like-minded people exist in each place - and where. Combined with our message testing data, that provides a complete dataset to tailor the design and communication of a new development anywhere in the country so that it stands the best chance of achieving community support.
Our data cannot, and should not, replace on the ground engagement, but it does provide a robust assessment of representative local opinion, so that decision-makers have a balanced view of preferences in a local area, and are not captured by vocal minorities.
What have we found?
Let’s start with a nice map. Figure 1 plots the Support RAG for each Local Authority in Great Britain. What’s immediately obvious is that support for development in general follows population density. Our league table provides a glanceable guide to the same data, just for England.
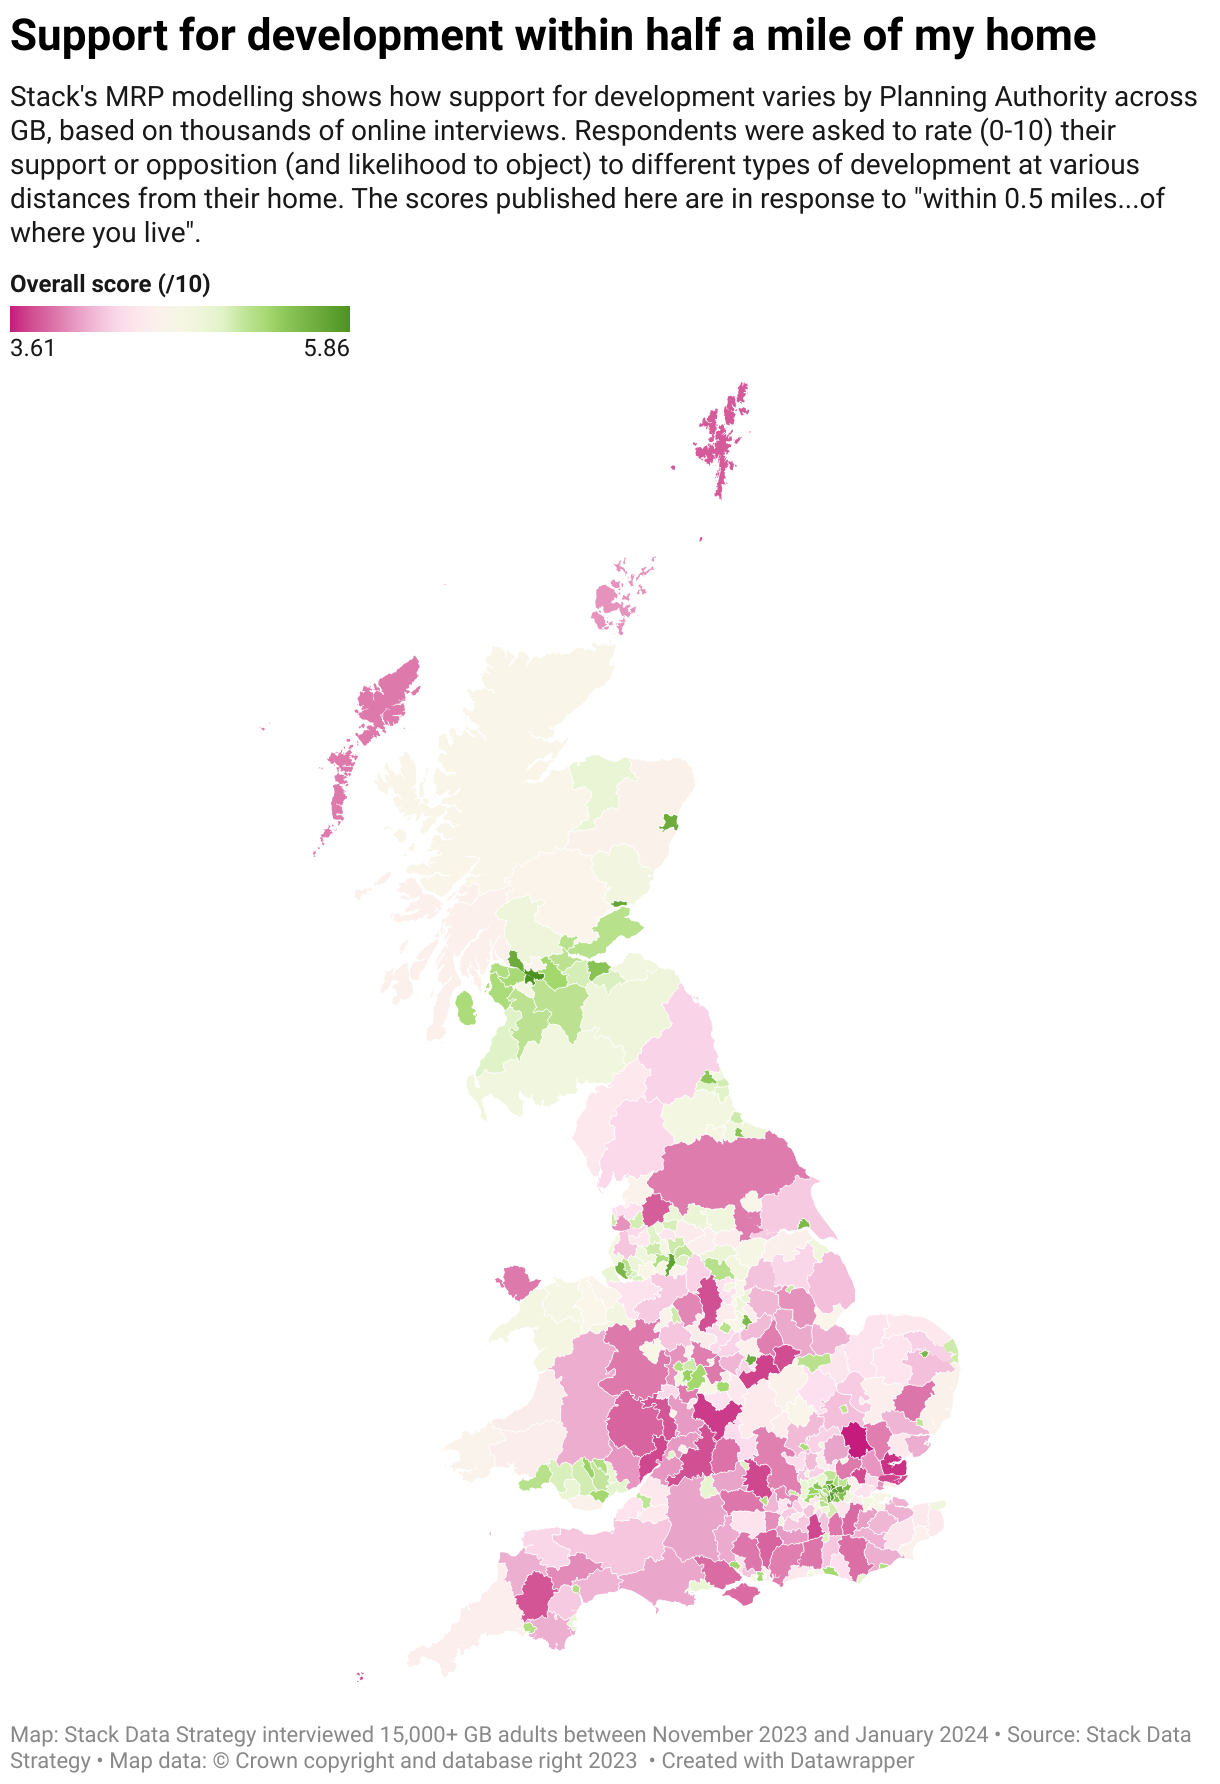
Figure 1: interactive map of Stack’s Support RAG data across GB
There are a host of fascinating relationships in the data
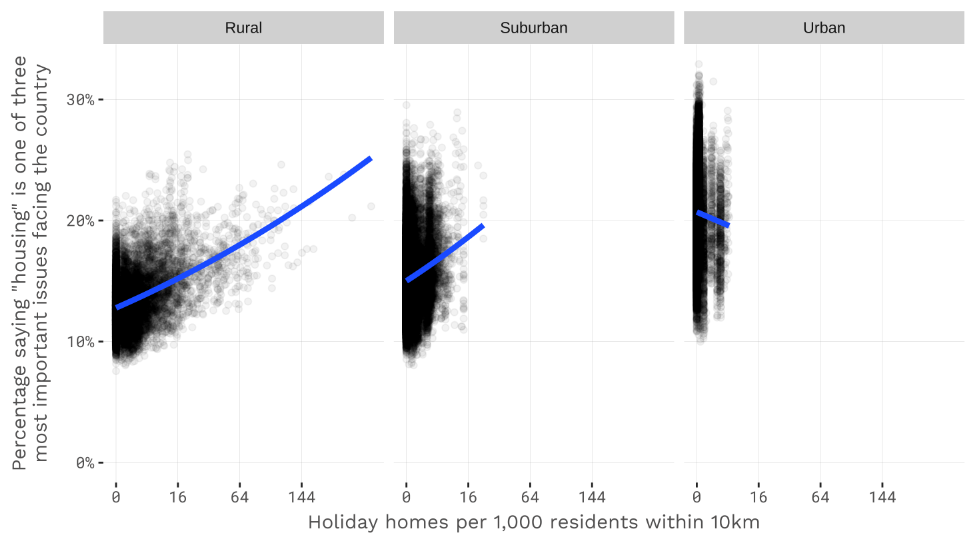
In general we see strong relationships between support for development and house prices (lower house prices correspond with higher support for new development, and vice versa). There’s another interesting dynamic given policy debates in this parliament: holiday homes. As Figure 2 shows, a higher density of holiday homes - specifically in rural areas - corresponds with greater agreement that housing is one of the most important issues facing the country (a slightly different question we also ask), which partly explains Cornwall’s relatively high place in the national “league table”.

Not all developments are created equal
We asked people’s support for “new private family housing”, “a new block of flats”, “a new social housing estate”, “a new shopping and entertainment complex” and a few others. Support and opposition for each varies, please get in touch for more detailed analysis! This chart (left) shows the overall RAG, the “private family housing RAG”, and the change between the two, and highlights the potential that support exists for “private family housing” even in the least supportive places: the increase for that type of housing from the overall RAG is most pronounced in the least supportive 15 Local Authorities.
Just as in a political campaign, different arguments move different people
Figure 3 plots a brief extract from the message testing data we have been building up: we call out the least supportive segments of the population and compare which messages they find most persuasive versus the wider population. The concentration of these segments - and the messages they prefer - does vary from place to place, but in general emphasising job creation and the opportunity for their grandchildren to own and rent affordably are likeliest to appeal to this (largely older) audience.
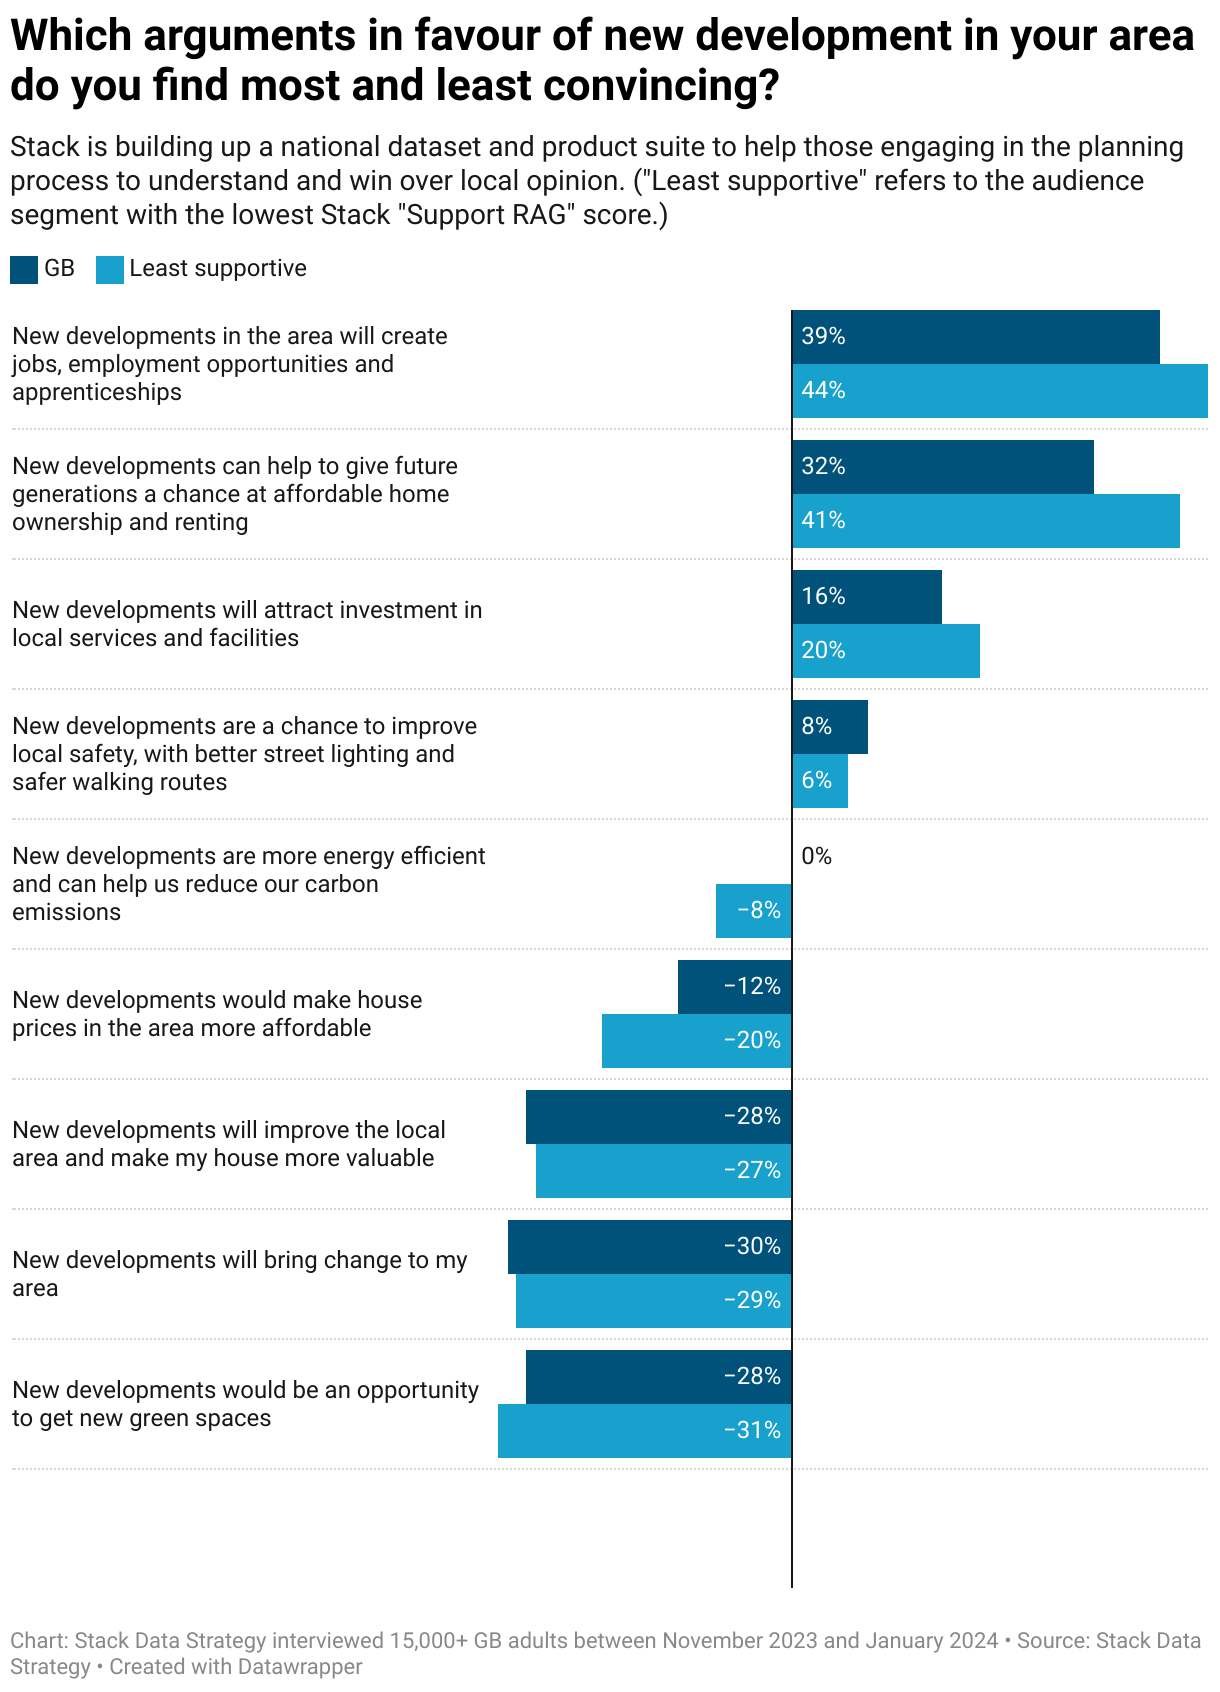
Figure 3: which arguments are found persuasive nationally and amongst those Stack identifies as the least supportive of development
Age matters in planning, too
Attitudinal clustering helps to explain difference, but (just as in politics) so does something simple like age. Figure 4 breaks down our more detailed priorities data by age-band, and again highlights the least support audience segment. Older people are likelier than the national average to want a new doctor’s surgery, and younger people are likelier to emphasise action on affordable housing. The variance at a Local Authority, ward and Output Area level is what you need to understand if you want to increase your chances of winning over a local audience to the need for your development, and to persuade local decision-makers that you’ve done everything possible to understand representative local opinion.
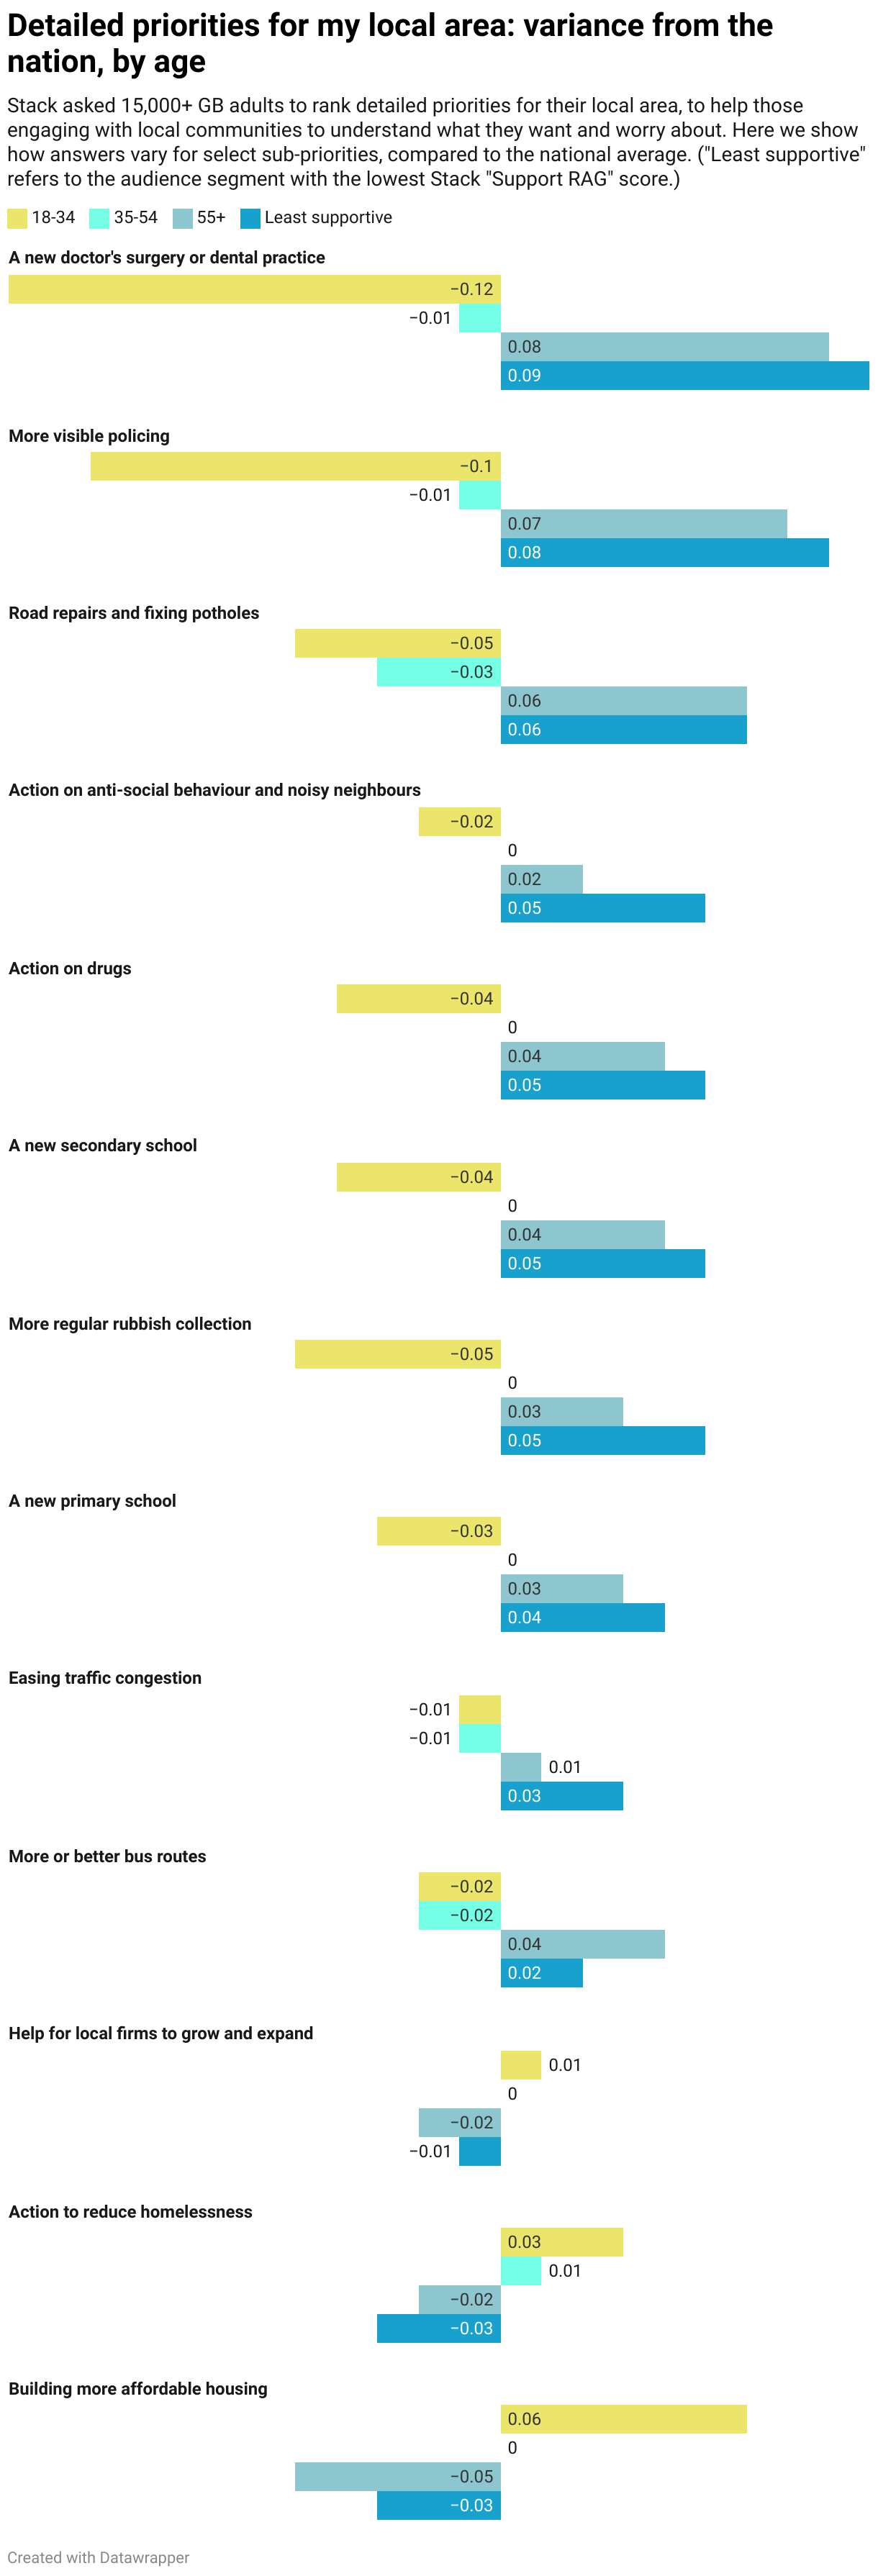
Figure 4: Selection of sub-priorities, compared to the national average
How can I get in touch?
Email us at info@stackdatastrategy.com and we’ll be delighted to run you through all the detailed underlying data, and to see how we can help you understand local opinion.