Delivering 1.5m new homes: the bad news
The window of opportunity may be closing. In the period that the new Labour government has been promoting housebuilding and planning reform as essential, public support for local housebuilding has been dropping.
Between May 2024 and February 2025, our data shows a net drop in support of 11% for building homes in a respondent’s local area.
What’s especially striking is where these drops in support are coming from: the very groups who stand to gain the most from new development. Among renters we have seen support fall by 14%. Among 18-34 year olds support has dropped by 17%. (These drops show up in other data too, such as YouGov’s time series on a very similar question.)

“To what extent would you support or oppose more homes being built near to where you live?” (Net support: supporters minus opponents)
Worryingly this drop in support is also happening all across the country.
We used MRP to model support for local housebuilding in May 2024 and February 2025 respectively, so we could measure the change by local authority. What we found is a cause for concern across the sector: the drop is steeper in those places expected to carry the biggest burden under the new targets.

Change in support (y axis) per LPA, with LPAs plotted according to their annual target under the updated method (x axis)
Since May 2024, support has dropped in all but 42 LPAs, and the drop is biggest in places with the highest targets under the proposed method. In May 2024, the combined housing target under the new proposed method in places with strong net support (+50% or more) was 70,905. Nowhere now has net support above +50%, even London.
In May 2024, LPAs with net opposition to local housebuilding (of which there were 33) were on the hook for 33,826 new homes each year under the proposed method. That number has now swelled to 56,428, in 59 LPAs.
Many of those 59 LPAs are in Kent, Leicestershire, Cambridgeshire, Lincolnshire, Derbyshire…all places Reform dramatically increased its representation at County Council level in the recent Local Elections.
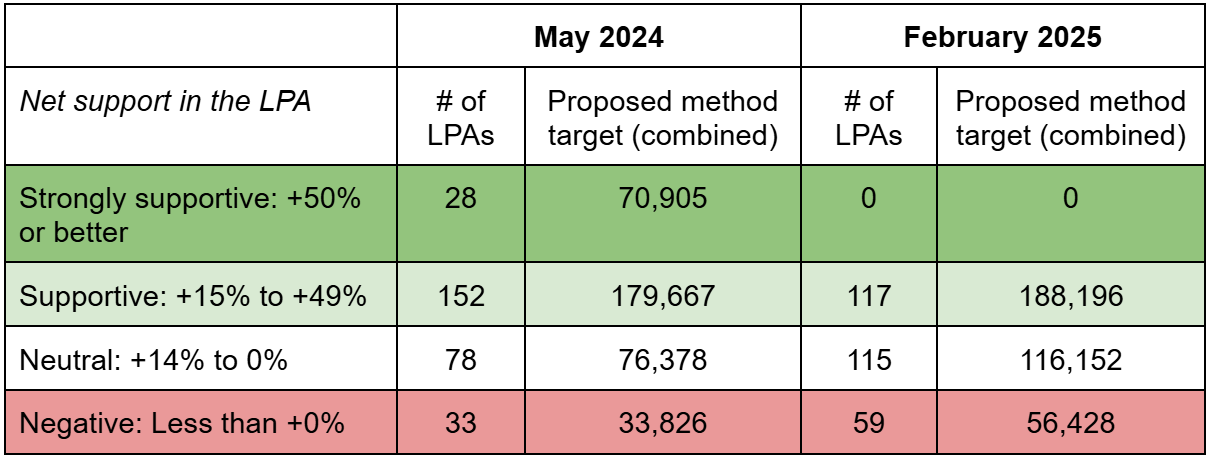
Table showing grouped net support for local housebuilding in LPAs, change over time and the current target per LPA under the updated method.
The optimistic perspective is that, first, just over 300,000 of the new annual target of 360,000 new homes still sits with LPAs where the local population is net-neutral to net-supportive. Second, the drop in net support is not a straightforward transformation of supporters into opponents, but a subtler movement from support into neutrality.
Just as support has been lost, so it can be won back. Whether - and if so how - opponents can be turned into neutrals, and neutrals into supporters, is where Stack comes in.
All of Stack’s data relating to development, planning and the built environment is now accessible via strata: check it out for free!
Explore the series: